
Despite the many major negatives, macro and external, to the global economy, much of it has been localised somewhat. The ongoing sovereign debt default issue in E.U., even the unrest in Middle East and some African nations, ... these events did rocked the markets as it should but none of the global equity markets are even ready for a correction.
Even the QE1 and 2 (quantitative easing) seems to have lent more strength to a lower USD which is not a bad thing for US stocks. Usually when you do that, interest rates will go up a lot but the recovery domestically is still muted. However, the US stock indices are not so aligned to the domestic recovery as recent weeks have show that the big boys are registering good profits growth as their tentacles are pretty much extended in emerging markets.
Following on on that, the funds have to go somewhere, owing to the growing "debasement of the USD movement" (aww shucks, you are going to hear a lot more of that new lingo), many have moved out of Treasuries. Usually in such a scenario with massive notes printed by Federal Reserve, they would go for select commodities, well gold has risen an awful lot, but thankfully gold is not a major item in the production chain. However, even though other hard commodities have rise as well, you cannot really justify the extended bullishness, in fact most hard commodities are a little over bought for now.
Oil is a unique animal, but somehow most economies have learnt to live with US$100-110 oil prices. I guess if it hits US$150 for a prolonged period, then we could see a bigger pullback in stock markets.
So, all said, funds are flowing out of Treasuries, where to? You can't all go into gold, not while corporates are registering good profit growth, which is to say, the world may have been blinded by looking too much on the negatives (all the above issues in a negative way). This is an important point, the global media, be it machinery, printed, internet or TV have tended to give a lot more airtime to blowouts, wars, QE2, oil prices, E.U. sovereign debt crisis, natural disasters ... at the expense of a more sobering look that much of the global trade and production have been chugging along nicely since 2008.

When to sell, when the Fortunes, Wall Street Journals andInternational Business Weeks start to turn bullish on stocks. Trust me, they always do that very well.

The CPB Netherlands Bureau for Economic Policy Analysis released its monthly on world trade and world industrial production for the month of February. Here are some of the highlights:
- World trade volume increased in February for the seventh consecutive month, bringing global trade to a new all-time record high (see chart). This was also the third month in a row that world trade was above the previous peaks during early 2008 when the U.S. recession and financial crisis started spreading, causing world trade to drop by 20% in 2009.
- World trade in February was 10.5% above its year-ago level, and marked the 14th consecutive month of double-digit annual growth starting in December of 2009. Compared to the cyclical high in April 2008, world trade volume has recovered to a level that is now 2% higher than its previous peak. Compared to the cyclical low in May 2009, global trade has increased by 28% through February of this year.
- World industrial output was the same in February compared to January, but was above its year-ago level by 7.4%. World output in the first two months of 2011 established a new, all-time record high level, which is 5.2% above the previous cyclical high of 134.4 in March 2008 (see chart above). After falling by 12% during the global recession in 2008-2009, world output has increased by almost 20% during the last two years of a strong global rebound. Global output has increased in almost every month compared to the previous month during the worldwide recovery that started in 2009, with only one month of decline in industrial output in the last two years.
Bottom Line: Based on the ongoing and solid improvements in both international trade and world output, especially the fact that global trade and production are both at all-time historical highs, I think we can now say that the world economy has made a complete recovery from the financial crisis and global slowdown in 2008 and 2009. The remarkable recovery in the global economy over the last few years is a testament to the ability of markets to recover from even a severe financial crisis and the worst economic slowdown in generations. Even though there are still many uncertainties and headwinds moving forward, the strong world economic recovery so far is both remarkable and encouraging as we hopefully have entered a new period of global growth, expansion and prosperity.

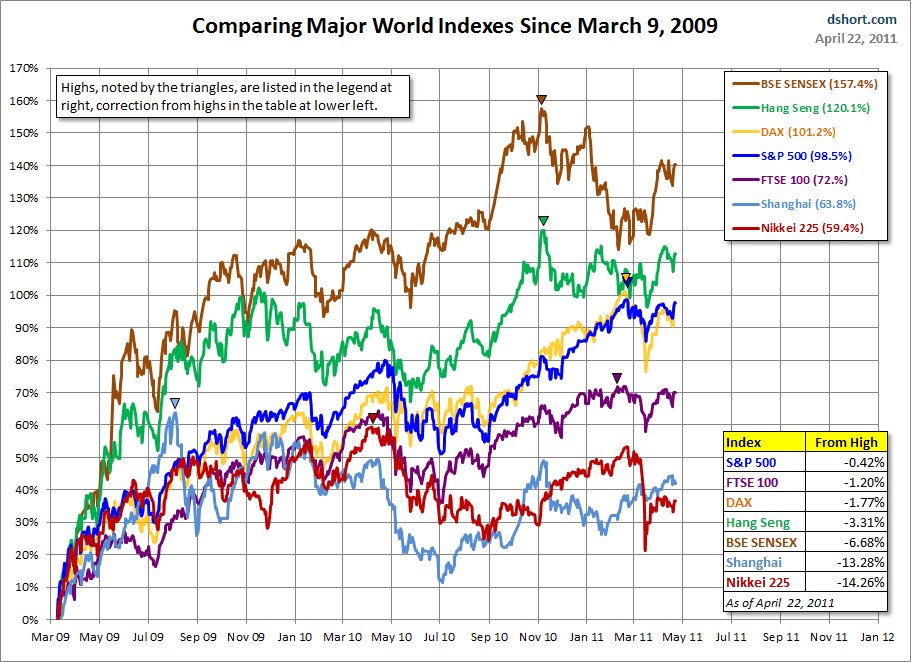
The chart below illustrates the comparative performance of World Markets since March 9, 2009. The start date is arbitrary: The S&P 500 and BSE SENSEX hit their lows on March 9th, the Nikkei 225 on March 10th, the DAX on March 6th, the FTSE on March 3rd, the Shanghai Composite on November 4, 2008, and the Hang Seng even earlier on October 27, 2008. However, by aligning on the same day and measuring the percent change, we get a better sense of the relative performance than if we align the lows.
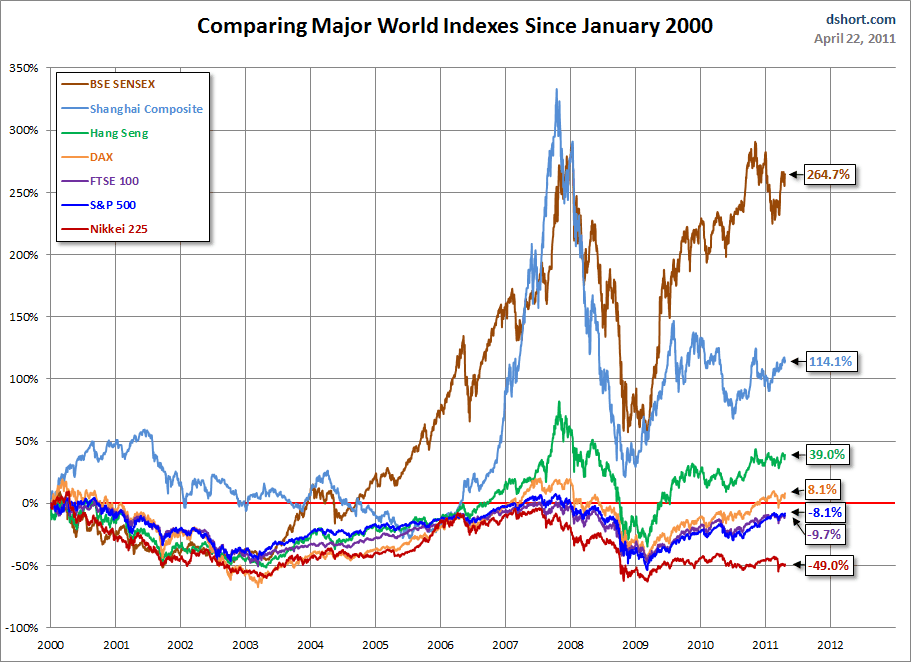
A Longer Look Back
Here is the same chart starting from the turn of 21st century. The relative over-performance of the emerging markets (Shanghai, Mumbai, Hang Seng) is readily apparent. However the pattern has been less apparent over the past few months.

3 comments:
Why every-time US economy is in trouble, they have 2 run 2 their
great printing press 2 print money
out of thin air & also insist that it must print faster than the silver
bullet that is going 2 hit its target?
Hi Dali, sounds like you're long HK at the moment
Any views on sector allocation and stock picks within HK/China? Would appreciate some of your insights outside of Malaysia
Would love to trade in ASEAN but unfortunately, liquidity is an issue for me. Thanks
Hi Dali, sounds like you're long HK at the moment
Any views on sector allocation and stock picks within the HK/China space?
Would appreciate some insights outside of Malaysia once in a while
Would love to trade in ASEAN but unfortunately, liquidity is an issue
Thanks
Post a Comment