Showing posts with label length of bear markets. Show all posts

Tuesday, September 01, 2009

Bear Markets, Rebound Rallies, Follow Up Correction, Trading Range Bound

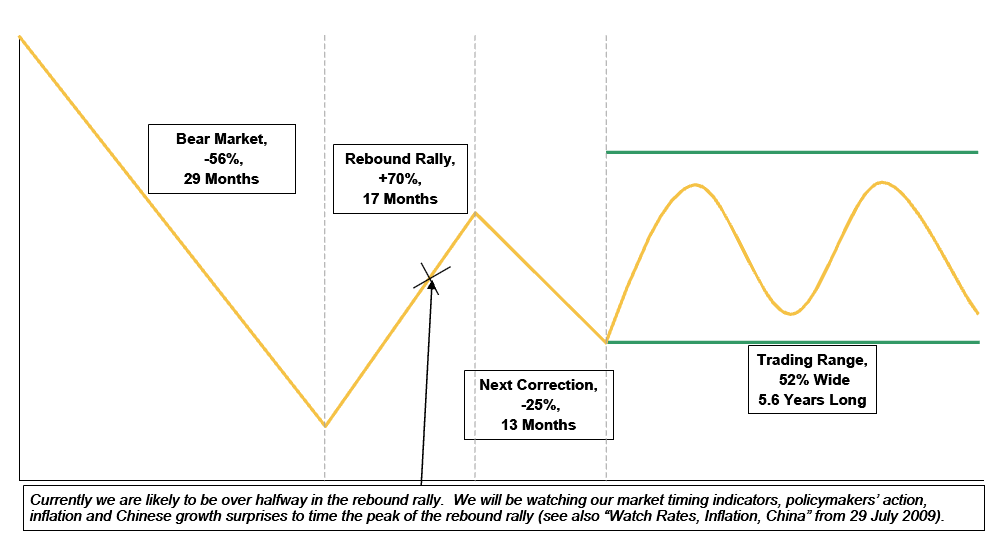
This fascinating composite chart below is courtesy of the Strategy desk of Morgan Stanley Europe. It shows what the average of the past 19 major Bear markets globally have looked like:

>

Typical Secular Bear Market and Its Aftermath
secular-bear-markets

>

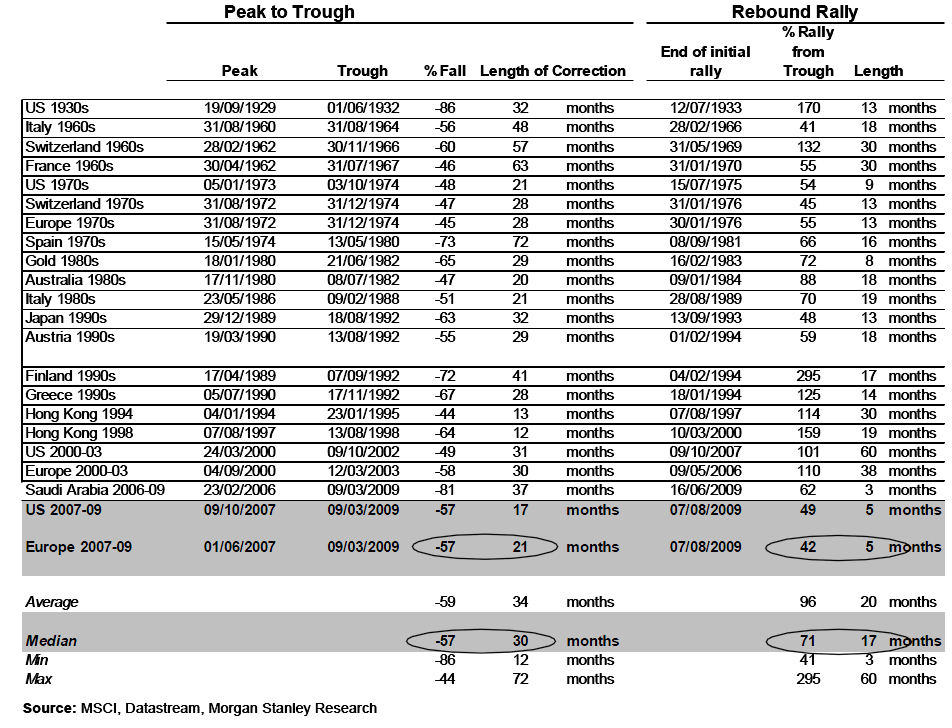
The Chart represents typical secular bear markets based on MS’s sample of 19 such bear markets as shown after the jump. Can we trust what is typical, or are all bear markets alike? The chart should serve as a benchmark to have an idea of where we are at this point in time, and to really seek out if and when there is a subsequent correction in the works.

This table shows Secular Bear Markets and Subsequent Rebound Rally:

>
secular-bear-rebound

Saturday, April 18, 2009

Putting Bear Markets Into Perspective


Putting the 4 truly bad bear markets next to each other kind of puts into perspective where we are. The grey line is the Great Depression, were the markets lost as much as 89.2% before recovering. The 73-74 oil crisis saw equity markets losing 48.2% before rebounding. The internet boom and crash saw equities losing 49.1% before recovering.

The current correction went as low as losing 56.8% and has since recovered some 28% from its low. This is not to say that we have definitely touched the low point, but it looks persuasive enough. I would say that we have a better than 75% chance NOT to revisit the lows again, which means we should recover slowly from here.


p/s photos: Maggie Wu