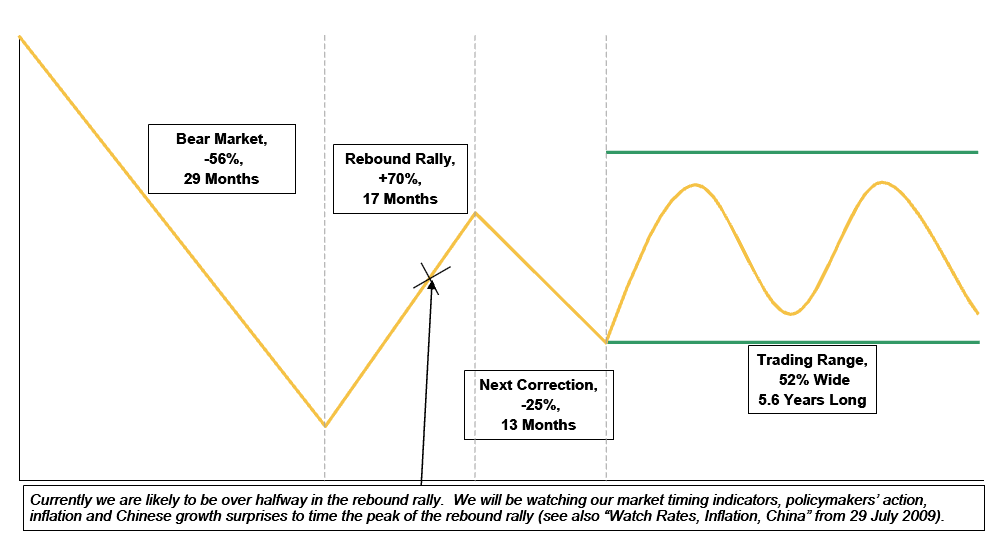
This fascinating composite chart below is courtesy of the Strategy desk of Morgan Stanley Europe. It shows what the average of the past 19 major Bear markets globally have looked like:
>
Typical Secular Bear Market and Its Aftermath
>
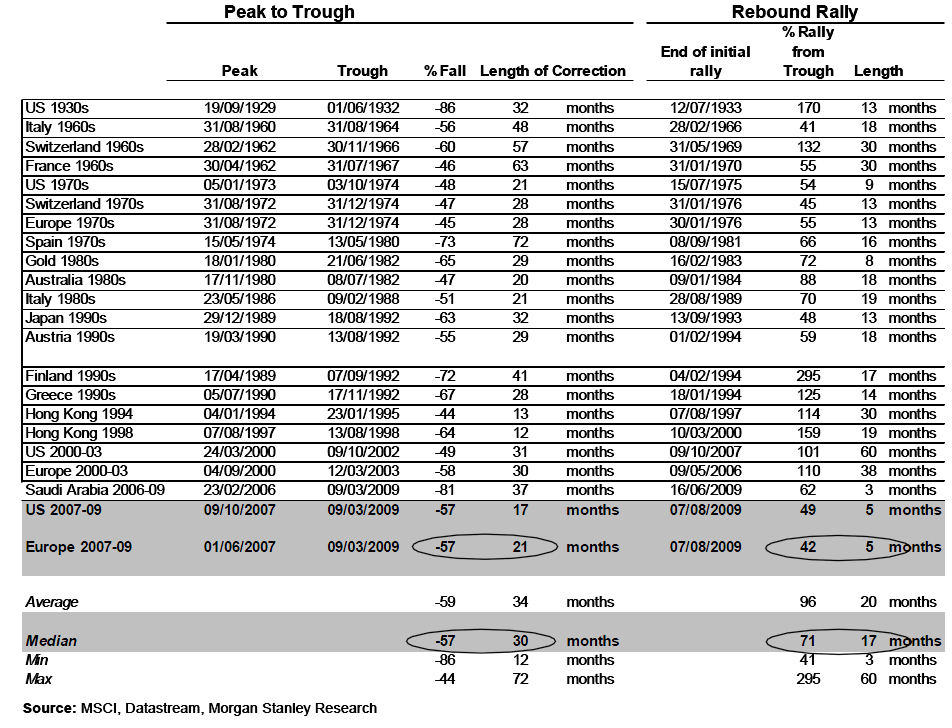
The Chart represents typical secular bear markets based on MS’s sample of 19 such bear markets as shown after the jump. Can we trust what is typical, or are all bear markets alike? The chart should serve as a benchmark to have an idea of where we are at this point in time, and to really seek out if and when there is a subsequent correction in the works.
This table shows Secular Bear Markets and Subsequent Rebound Rally:
>


1 comment:
How I wish is true, then could we use it to time the market, but nobody in this world could predict this accurately.
Post a Comment