Showing posts with label REITs. Show all posts

Monday, July 31, 2023

Malaysian REITs ... Beauty Contest


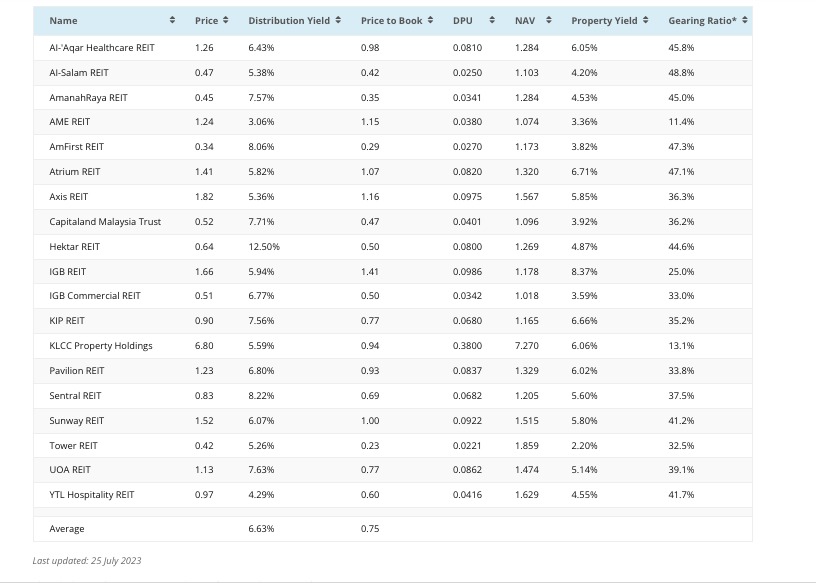
A friend asked me about Malaysian REITs... they all look so cheap. What gives. Looking at the above table there are only 5 REITS that trades at its NAV or higher: AME, Atrium, Axis, IGB, and Sunway.

If you look at Price to Book, i.e. discount to NAV, many trade between 40%-70% discount to NAV. How should we view such investments?

Discount Trap/Value Trap

Most REITs do trade at a discount, that's a given, but an acceptable discount should only be between 5%-15%, anything more implies there's something more that we have missed out.

Potential Factors Driving Discounts:

a) an environment of higher interest rates, which eats into net yield as rentals are not so agile at moving in tandem with real interest rates... not to mention the higher cost of refinancing;

b) economic activity outlook depressing: if we are looking at a depression over the horizon, there will be more breaking of leases and rentals, and subsequent downward pressure on yields;

c) owing to the age/design of properties under management, investors may be looking at lower rentals going forward, thus exacerbating the discount;

d) diversification or non-diversification can and will affect the discount, and so too is the "Grading" of the said property;

e) vacancy rates, the existence of newer competing projects in surrounding areas, the deterioration of infra-supporting business activity;

f) the aging aspect and requirements for repairs and upgrades;

g) the liquidity being traded, as usual, a bigger REIT would always win over a smaller capitalized REIT, the ability to get in and out, the ability to get a sizable position;

h) more importantly:  access to more capital sources, transparency, and a good management team;

Locally, investors are most gloomy with Hotels and Resorts type REITs. Will take a few more years before we need to look at them. Investors are most keen on Healthcare related REITs. The other sub-sector that is slightly optimistic is the Office REITs, while the Industrial REITs are not that exciting, although nowhere as gloomy as Hotels/Resorts REITs.


Using Discounts Smartly


When you based on just an absolute discount figure to NAV, you are likely to be caught in the value trap, even if the yield looks attractive. The best way to utilize a discount to NAV is to use the historical discount line over time. Each REIT has its nuances and timeline. If the yield is "good in your view", buy only when the discount is BELOW the average discount to NAV figure. Use a 5 percentage points basis before acting. That means when it is at least 5 percentage points below the average. You can use that also when selling, sell when it's 5 percentage points above the average line.

REITs Rosetta Stone

Local REITs taxation (or rather the non-taxation aspect) is the key. If the government even starts to consider any policy change to tax them, it will be more than disastrous. However, if we follow the regional policy to stay competitive, that is not likely to happen anytime soon.


What Do I Prefer

Well, good management first of all. I also like to look at family-owned REITs. There are family-owned ones that have good and solid professional management and some that don't. Do they do arm-length transactions?

The other aspect I look at is how "dependent" they are on the yearly dividends. To that end, I mean that the shares and other equity instruments are "not sold" or held in trust, and the rest of the family relies on the dividends more so than others.

I prefer UOA, IGB and KIP. But that's just me.

Wednesday, August 12, 2009

Asset Class Returns As At 31 July 2009


The month of July was a very exciting month. Things really moved! Emerging markets continued to defy most expert predictions by surging headlong, led by China. It wasn't just emerging markets but developed markets surged as well. The funny thing is that when emerging markets moved, we always get the nasty and critical pieces on how and why emerging markets are too risky and have no reason to outperform the developed markets - hello... how the fuck do you think we got into this current mess, thanks to the fucked up brilliant greedy financial experts in developed markets!!!

REITs is a very interesting vehicle as they will only attract buyers when investors can see a genuine bottoming in the real estate space. Although the REITs are mainly representative of the US sector, it does indicate some vibrancy - despite its 10.4% gain last month, REITs as a whole is still down 41.3% year to date, an indication that there is still a long road to recovery. Another way to look at them is that it is time to really buy aggressively those REITs that currently yields very well (low teens) in Grade A or even Grade B offices. Wait another two months, and it won't be so attractive anymore.

080309.GIF

Despite the concerns over commodity price gains in recent weeks, its pretty clear that the gains have not been excessive. As a group it is only up 3.2% and on a year to date basis, it is still down by 38%.


p/s photos: Chrissie Chau


Friday, May 29, 2009

A Quick Run-Through Of Global Real Estate Hotspots


Real estate is a cumbersome slow moving asset. Its not like stock prices which can move up and down a few percent on the same day. Real estate is however a reflection of liquidity, a wealth indicator, a confidence indicator, a leading indicator, and a lagging indicator as well, depending on how you argue and look at things. Hence it opportune to have a peek at some real estate hotspots to see if the surprising bull run ties in with the investing situation in real estate.

Australia

The Australian housing market downturn is likely to be milder than in the U.S., UK and EU in 2009. Australia's house price correction had a head start going back to 2003. Furthermore, housing demand from migrants to the commodities-rich west and the chronic housing shortage in eastern Australia will keep prices from stabilizing back at pre-boom levels unless Australia fails to avoid a deep recession. Indeed, building approvals and housing loans to owner-occupiers began to recover since October 2008 after the government doubled grants for first-time purchases of homes until December 2009. Mortgage interest rates fell to their lowest level in four decades after the Reserve Bank of Australia cut the overnight cash rate 425bp within a year to 3% in April 2009, the lowest since 1960. Tax cuts, government handouts and lower petrol prices will also raise the affordability of housing. Affordability may not mean higher house prices, though. Despite increased sales (new home sales in Q1 2009 rose 20% since end-2008), house prices fell 6.7% y/y in Q1 2009. Rising unemployment and lower household wealth will keep buying sentiment mild this year but, short of a deep recession, improved affordability and ongoing housing shortages will help Australia avoid a housing crash as bad as in the U.S. and Europe.


New Zealand

New Zealand housing market is in worse shape than Australia's but is also likely to avoid as deep a correction as in the U.S. and Europe. The Reserve Bank of New Zealand has cut 575bp since July 2008 to 2.5% in April 2009 but longer-term, fixed mortgage rates have recently begun to rise again due to expectations of a quick recovery and higher interest rates. Fiscal policy has been laissez-faire towards the recession, opting merely for tax cuts as the government would rather not stand in the way of the economy's structural adjustment. With housing assets 5.7 times the household disposable income, New Zealand property markets are even more leveraged than their U.S. counterparts. House prices fell 8% in 2008 and are down 9.2% y/y as of April 2009. Some analysts believe the housing market will bottom on an annual basis in 2009. The housing market has already bottomed on a month-over-month basis, with the median price rising from $325,000 in January 2009 to $340,000 in April. Immigration has revived housing demand and sales have been strongest in the low-end segment thanks to increased affordability. However, new building starts and new home sales remain below the boom levels of 2004 and will likely remain so due to credit constraints, rising unemployment and sluggish economic growth in the year ahead.


United Kingdom

The housing sector is one the most important factors affecting the economic slump in the UK, which is similar in many ways to the difficulties facing the U.S. economy. The latest data on the UK housing sector continues to be mixed but some analysts are tentative to call the bottom in Q2 2009. The latest Halifax price index fell 1.7% m/m in April with price levels back to 2004 readings. Nationwide data brought a 0.4% decline in April but the y/y contraction fell from 15.7% in March to 15% in April. Mortgage lending showed some signs of recovery in April according to the data from CML with a 9% m/m drop. Despite hopes of a recovery, lending is still 60% lower than a year. The monthly data could be quite volatile in the coming months, drawing a slow bottom-like pattern. A real recovery of the housing sector will depend on improvement in the personal income and employment situation in the economy, which are not yet foreseen.


Asia

Asia has witnessed sharp real estate correction led by the Asian Tigers, plus China, India and Vietnam. All these markets saw declining home and office prices and rentals, lower sales and rising vacancies. Prices are approaching fundamental values and slowing construction activity might somewhat close the estimated excess supply. But further price and rental correction are imminent. This because household and corporate demand will remain subdued in 2009 despite policy measures such as interest rate cuts and fiscal incentives as well as attractive discounts offered by realtors. Slowing or contracting consumer spending and rising job losses in most economies are hitting residential and retail markets. Slowing corporate earnings and capex, declining exports and liquidity crunch are weighing down on commercial real estate. Though banks are reducing exposure to the real estate sector, lower earnings among realtors and income pressures among consumers are raising the risk of delinquencies. Nonetheless, as the global liquidity crunch abates overtime, high growth potential and attractive returns, given rising incomes and urbanization in developing Asia, will revive domestic and foreign investor interests in Asia's real estate.

China

Unlike many global markets, the residential property market in China is showing some signs of stabilization. Significant price discounting, lower mortgage rates, incentives and overly ample credit extension are contributing to an increase in transactions and helping to reduce the existing inventory. Chinese property prices began falling in mid-2008 as anti-speculation measures and slower economic growth reduced investment. However, transactions could slow if authorities rein in lending growth in mid-2009. Commercial property has yet to show signs of recovery. The global capex retrenchment is also putting pressure on commercial property as it delays some expansion plans especially by foreign companies. Although domestic companies are somewhat less affected, a slower pace of consumption growth may weigh on both office and retail property markets.

HK

The HK real estate seems to be bubbling up again at least in terms of sales to investors as increased credit availability, and a weakening US and Hong Kong dollar, encourage investment. However, new tenants remain scarce and vacancies are on the rise, suggesting further downward pressure on prices, especially as Hong Kong’s economy, including the financial sector, continues to contract and consumption weakens.

India

Home prices in India have corrected 15% to as much as 40% in some prime areas since September 2008. The recent pick-up in demand due to discounts by realtors and mortgage rate cuts by banks will be largely outweighed by the excess supply of homes in the market. So another 15-20% price correction is underway in residential and office markets over the next 6-to-8 quarters. This is especially because bank lending standards have tightened, households face wealth erosion and slowing job market, affordability remains low and corporate sector faces liquidity pressures. Mall construction and rentals have taken a hit and so have activity and employment in the construction sector. Drying funding from foreign investors and domestic equity market is forcing the indebted real estate firms to divest shares to raise capital, hold back expansion plans, and refinance bank loans which has been helped by recent central bank measures.

Singapore

Singapore's real estate sector started moderating in Q2 2008 and home and office prices witnessed record decline of over 10% in Q1 2009 with rents also falling sharply. Another 15% to as much as 25% correction is expected in the residential sector and may be even higher in the luxury section. Woes in the financial and service sectors, negative wealth effects among households and shrinking population due to outflow of laid-off immigrants – all will weigh down on residential and retail real estate. This will be exacerbated by falling speculative investment due to tight domestic and foreign liquidity.

Vietnam

Vietnam's property prices are down over 30% in some markets with luxury section taking the biggest hit and office rentals showing steep decline. Though realtors have been cutting prices and banks are resuming lending, demand has been slow to pick up. Investors also remain reluctant to enter the market since they largely depend on foreign liquidity. The sector is unlikely to improve in 2009 and this will be exacerbated by lower investment via remittances and FDI.

Japan
Economic downside risk in Japan was highlighted when exports plummeted by 49% year-over-year in February. The steep decline in exports, a key driver of economic growth, stemmed from faltering global demand and the strong Japanese yen. Amid the dramatic drop in external trade, domestic consumption slowed in the quarter as well. The government reports that, on a year-over-year basis in February, household spending shrank 3.5% and retail sales contracted by 5.8%, the steepest decline in seven years. Imports declined 43%. Bank of Japan’s latest tankan survey in March shows that large manufacturers turned more pessimistic about business prospects, which does not bode well for industrial production or the labor market. Indeed, the unemployment rate rose to 4.4% in February, a three-year high. The excess capacity resulting from the collapse in demand and consumption has increased the risk of deflation. Headline inflation contracted by 0.1% in February. In one of the few bright spots in the Japanese economy, bank lending in Japan grew by nearly 4% year-over-year in January and February, much higher than the growth during the same months last year.
Commercial land values are falling. Land prices in the three major urban areas (Greater Tokyo, Nagoya and Osaka) in January declined by 5.4% year-over-year, the first drop in four years, according to the government. The decline was more pronounced in Greater Tokyo, where the government said that prices dropped 6.1% in January. Meanwhile, the tightened lending policies adopted by banks, coupled with the difficult business environment, have pushed up the number of companies filing for bankruptcy. In the first two months of 2009, corporate bankruptcies rose 25.5% over the previous year. That helped prompt a rise in office vacancy in Tokyo’s five wards to 6.1% in March, from 4.7% at year-end 2008. Vacancies are likely to rise further as companies consolidate their space requirements. Newly constructed buildings will be hard to fill as demand dwindles. We believe that weak demand will persist this year and competition for tenants will lead to more concessions from landlords – rental discounts, longer rent-free periods and other incentives. With demand for class-A office space likely to remain soft and rents under pressure, cap rates for class-A offices will likely rise in the quarters ahead, possibly by 10-30 bps. Commercial land prices will see further downside as well. Residential land prices are also falling. Land prices in the three major urban areas declined by 3.5% in January from a year ago, according to the government, which said that the decline was a bit steeper, 4.4%, in Greater Tokyo. The volume and velocity of transactions has slowed sharply. In Tokyo, only 621 new condominium units were marketed in January with a contract ratio of 67%. The number of unsold units stood at about 4,200 units at the end of January, almost double from a year ago. As part of the national budget for fiscal year 2009, the government has included steps to rejuvenate housing demand that include tax breaks of up to 6 million yen for home buyers who move into their property in 2009 or 2010. The amount of the tax break will be lowered gradually after 2010.

REIT Markets
REIT markets in Asia posted mixed results in the first quarter. REITs gained in Hong Kong (14%) and Malaysia (5.3%), but J-REITs and S-REITs posted negative returns, as investors raised concerns about refinancing issues. Still, REITs mostly outperformed the broader equity markets, possibly because investors were attracted by the deep discounts to net asset values (NAV) and higher dividend yields.


Total Returns, REITs vs. All Equities

1Q09 / 2008 / 2007 / 2006 / 2005

REITs

Hong Kong 14.0% / -28.9% / 10.4% / 9.8% / 2.0%
Japan -4.7% / -49.0% / -2.3% / 29.7% / 13.5%

Malaysia 5.3% / -14.8% / 17.8% / N.A. / N.A.

Singapore -1.1% / -56.1% / 2.8% / 57.9% / 22.2%

All Equities

Hong Kong 0.2% / -52.4% / 40.3% / 32.6% / 11.3%

Japan -8.9% / -41.4% / -11.3% / 2.9% / 47.4%

Malaysia 1.0% / -39.7% / 43.0% / 31.4% / 1.1%

Singapore -3.7% / -50.9% / 22.1% / 33.9% / 16.1%


Indeed REIT yield premiums ranged from 569 to 940 bps above long-term government bond yields. As of the end of March, the region had 83 REITs with a total market capitalization of US$44.4 billion, which is moderately down from US$45.2 billion at end of last year. The weighted average dividend yield fell by 30 bps in the first quarter, to 8.2%.


Market Cap and Dividend Yields of Asian REITs

No. of REITs / Market Cap (US$ bil.) / Average Dividend Yield / Risk-free Rate /* Risk Premium (bps)
Japan 41 / 26.28 / 7.03% / 1.34% / 569

Singapore 21 / 9.93 / 11.40% / 2.00% / 940

Hong Kong 7 / 6.92 / 7.80% / 1.93% / 587
Malaysia 11 /1.10 / 10.80% / 1.89% / 891

Korea 3 / 0.17 / 10.60% / 4.68% / 592


Total 83 / $44.4 / 8.20% (weighted average based on market cap)


p/s photos: Zhou Weitong


Tuesday, March 03, 2009

Asset Class Returns As At 28 Feb 2009


It is very useful to look at how differing asset classes have performed on a month by month basis as markets are so volatile and it pays to get a pulse on the dying patient, being rolled in and out of ICU. The best asset to be in for February, ta-dah... is cash or better still 3 month T-bills.

What is gratifying is that emerging market bonds have stopped falling. Its good in the sense that the wholesale selling wave have dried up, or rather the de-leveraging process have almost dried up.

TIPs is headed for a big burst as the amount of money running into TIPs has been ridiculous. Selling has continued for bonds of foreign developed markets, primarily in European countries.

Emerging market equities have fallen only half as much as US stocks and foreign developed market equities, a significant sign that investors are finally differentiating the global impact. yes, it has and will hit emerging markets but they should be better equipped to reflate compared to the US and Europe.

030209.GIF

Like I said in January, REITs will still be the worst asset to be in, the carnage continues in REITs, dropping by a whopping 21% in February alone.


p/s photo: Anna Tsuchiya

Wednesday, February 04, 2009

Asset Class Returns As At 30 Jan 2009


It pays to keep a monitor on month to month performance of differing asset classes, especially in the current volatile times, as that will give us a leg up to get the pulse of risk aversion and shifts in investors investing strategy. For the first month of 2009, the best performing asset class was High Yield Bonds (+6.3%). That is extremely interesting. If we looked at the 12 month performance of High Yield Bonds, it is still down 17.5% (which means if we were to take out January's superior performance, High Yield Bonds would have recorded a yearly loss of some -23.8%. HYB got whacked royally in particular over the last 6 months as investors sold down HYB in preference for the safe Treasuries. Investors feared that many HYB corporates are either going to collapse or will have grave difficulty in finding fresh funding, and maybe that business conditions will be so bad that these HYB corporates will find it tough to service even the interest. The fact that buying has re-emerged in HYB in January indicates that there is some investors willing to re-look HYB, and that the bulk of the bad news may have been discounted or may have been more than priced into these HYB. Anyhow you look at it, its a good sign on less risk aversion.

REITs, in particular US REITs continued to be the worst performing asset class as invetsors totally ignore the yields and anticipate that many of the properties should be written down a lot more than what they are in the books. Commercial properties owned by REITs do not get much media attention as not many of them get sold down in the current market place. Even stretched owners with commercial properties will be able to get their banks to extend their grace period in these troubled times. Still, the continued selling in REITs indicate the overwhelming gloom surrounding the real estate arena in the US. Look for some gung-ho investor to start making a public offer for some of these REITs (ala YTL) as an indication of liquidity and confidence flowing back into the industry.

020209.GIF

The fact that the only positive performers were all bonds indicate that risk aversion is still high. Stay tuned to developments.