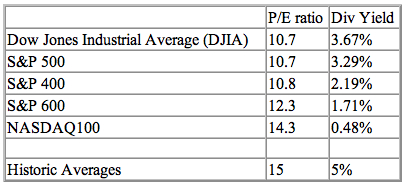
As things get more uncertain, it is useful to look at things that would help us understand the pulse of the market better. The first is the relative market valuations within various sectors or category of stocks. A look at the table below would allow us to form a good idea of the themes and plays in the markets now. Interestingly, the fundamentals indicate that investors have an appetite for risk. Tech stocks and small caps are being rewarded with the highest P/E ratios and these stocks deliver the lowest yields. Investors are pricing large cap stocks with higher yields more conservatively, possibly indicative of the uncertainty. Merrill Lynch analyst David Rosenberg recently revised his earnings forecast for S&P 500 stocks down to $28 in 2009. That puts the P/E for the S&P 500 at 29.5. He also projects operating earnings of $55 for 2010. Applying a classic recession-trough multiple of 12x against a forward EPS estimate of $55 would imply an ultimate low of 666 on the S&P 500, likely by October if our estimate of the timing for the end of the official downturn is accurate. That is easily another 20% down from present levels. If only things were that simple and straight forward. There is a theoretical valuation and projection, and there are things we cannot really project fully. In my view, the S&P 500 will not even dip below
Table 1: data as of market close, Feb 13, 2009 source: Yahoo! Finance
700 because of sellers' exhaustion. It all has to do with relative yield and returns analysis. Michael Carr noted correctly that by applying Rosenberg’s estimate to a different valuation model offers a slightly more bullish scenario. The “Fed model” uses the interest rate on the ten-year Treasury note to develop a market forecast. The current yield of 2.88% implies that the market can support a P/E ratio of 34.7 for 2009 earnings. This gives a fair value of 971 on the S&P 500, or more than 17% higher than the current level. However, there is an average 16% risk premium priced into stocks according to this model, which places the current level of the S&P 500 at fair market value. I would still side with the bulls on the current market tussle.
Now onto short positions in the US markets. This to me gives me a better feel on the volatility and negativity than say the VIX indicator. You get to see what real players are betting against and how the flow of positions are moving.
COMPANY / JAN 30, 2009 / JAN 15, 2009 / NET CHANGE / PCT CHANGE -----------------------------------------------------------------------------
FIVE BIGGEST INCREASES IN SHORT POSITIONS:
General Electric Co / 167,972,565 / 142,508,373 / 25,464,192 / 17.87%
New York Community / 28,781,736 / 18,439,584 / 10,342,152 / 56.09%
General Electric continues to be betted against - nobody really thinks that GE will collapsed but that margins and their financial side will drag the company share price lower with each quarterly earnings - good to short. Citigroup despite having losses guaranteed, are still a firm favourite for shorties. The company is not out of the woods yet. Surprisingly Bank of America is not here, I think it could be that the share price of BoA has gone too low for shorts to be interested.
FIVE BIGGEST DECREASES IN SHORT POSITIONS:
Nokia Corp / 18,552,903 / 38,313,687 / -19,760,784 / -51.58%
Well this group is the one you want to be in. It shows the companies that have seen most short positions being covered, generally meaning the stocks are more than likely to go up from hereon. Surprise to see Wal-Mart there, I think it was due to some betting that the recent quarterly results will surprise on the downside - nah, they did well, thus scaring the shorts to cover. Johnson & Johnson is thought to be a solid stock, but to the shorts, even good companies are good candidates to short because too much buying or too much good news means the company is priced to react nagatively to any slight hint of bad news.
FIVE BIGGEST POSITIONS:
Ford Motor Co / 273,286,779 / 270,453,510 / 2,833,269 / 1.05%
No company wants to be in this group. The longer they are in this category, the more downward pressure on the share price. Unless somehow these companies can engineer a dramatic short covering rally, e.g. beating analysts estimates or positive policy developments.
Generally speaking I don't see any major changes in sentiment from the positions taken by the shorts. They are reasonable plays, and they are plays which are basically betting on a down trending share price rather than looking for a total collapse or that the company's share price is going to zero.
As always, the most important indicator in my view, the yen rate. It has jumped again by a full yen to 94.5. Mark my words, the yen rate is big indicator of underlying market strength. As long as it keeps going up, more funds are actually being deployed back to equities of all types.
If we keep looking at latest released data, that would be pretty useless. The main reason why markets collapsed 6 months back was precisely forecasting the sluggish and depressing economic data we are seeing now and for at least the next 3-4 months. Bad data will not have the "negative impact" it had a few months back because the bad data 6 months ago was the trigger for a major re-evaluation of earnings and a down trending economy. The bad data now is largely playing itself out, hence much of it will not have the theoretical negative impact, or as bears call it "markets are ignoring the bad data at their own peril".
Stocks will have to be the first to move. Commodities will lag as the turnaround will take a bigger u-turn. As this is a risk aversion/confidence oversold market, substantive market gains will ease a lot of worried holders of corporate bonds. The other indicator to watch is the narrowing of corporate bonds and Treasuries spreads, which is also narrowing.Of course all this will not be a one way traffic, there will be stop-start all along the way. But I am of the view that the markets are OK for the first quarter of 2009.
Looking at the table, we are well on the way to being in the longest recession since the Great Depression. I foresee the recession ending by end of 3Q2009, which would make the recession about 21 months. In fact I am optimistic that we could be out of jail by July 2009 even, thus making it around 19 months.Considering the vast sums of liquidity and fiscal measures being handed out. The swiftness in response by almost all central bankers. The not-so-shy fiscal measures meted out. We are addressing the issues at a rapid rate. Fair to say that this credit crisis is a massive one as well. There is no playbook or textbook, but I do think the measures are already more than sufficient. We just need confidence to filter back to allow the liquidity to work its way.
BTW - More digging on the IJN-Sime Darby-EPU-MOF saga revealed that Sime Darby has finally called off the proposal. Interestingly, no one was really interested in running IJN, but rather it was attractive as it was sitting on about 12 hectares of reasonably prime and very flat land. Remember that IJN is on Jalan Tun Razak. Twelve hectares is very sizable. Hmmm...
Type
:
Announcement
Subject
:
Sime Darby Berhad’s interest in IJN Holdings Sdn Bhd (“IJN”)
Contents
:
We refer to Sime Darby Berhad's ("Company") announcements on 17, 18 and 23 December 2008 on the above matter.
The Company wishes to announce that it will not pursue its plan to acquire an equity stake in IJN.
The Company arrived at this decision after taking into consideration the public sentiment and feedback received since the Government announced that it had deferred its decision to allow Sime Darby to begin negotiations with the Ministry of Finance on taking a 51 per cent stake in IJN.
The Company, nevertheless, will continue to look for opportunities for expansion in the healthcare sector.
The prognosis was an unhedged opinion. After criticising economists and analysts for being wishy-washy, ... "on the one hand, however if the other thing happens..." , so i am glad some readers realised it was a straight out opinion. I do not expect many to agree, so thanks for the feedback. Its much easier to continue to be bearish, just regurgitate whats in the media - but of course I could be wrong. I will try to clarify some of the concerns, not to sway you, but to explain further my views.
Toxic assets too huge - It seems too big because its a one way traffic. It seems too big because of the unwinding and de-leveraging trends. It seems too big because everybody wants to be first out best dressed. What we have to be aware is that sometime soon these cash and liquidity will have to be placed out in some form or other. It seems too big because of risk aversion, rather than the inability to deal with the issues.
It will take a much longer time - Let's get the facts. Even during the Great Depression, we saw recessions lasting 22 months, and to me, its largely because we did not have the fiscal or monetary knowledge or tools to deal effectively and immediately with the issues then. In other views, some will argue that Japan too more than 10 years to work itself out of its 90s credit bubble. Well, thats because Japan did nothing for the first 10 years, seriously folks. If you compare to the immediacy of the many moves to tackle the issues during the current crisis, we would have a better appreciation of the comparison.
There are still time bombs - The greatest thing about this American financial markets, is their transparency. When the proverbial stuff hits the fan, everybody will be clamoring to rip open all wounds, especially the affected firms. The affected firms had to lay it all down as its pointless to try to hide. In fact, it would be a very shrewd move to let it all out so as to be part of the bailout. The transparency thing is very good because their firms are so large, i.e. no one main owner operated financial behemoth. Usually the largest shareholder holds less than 10%. The scrutiny is magnified with independent directors trying to save their behinds, not to mention the vulture bond holders trying to see if the firm is worth anything at all.
Is Roubini wrong then? - You all know I think the world of Nouriel Roubini. I have highlighted many of his opinions and he is by far the most astute and correct economist on the current financial turmoil bar none. By his accounts, he still sees some pockets of danger in the economy, but he is not as bearish now as he was a few months back. We also should note that a number of things are very fluid - Roubini worked with Timothy Geithner and Lawrence Summers many years in recent years. You can bet that the 3 of them will be discussing intimately on ways to address the issues. You cannot get better advice than from the man who predicted the carnage step by step, can you?
The new team - Well you have Geithner, Summers and de facto Roubini, throw in Paul Volcker as well - is that a more credible team than Paulson and Bernanke? The team has been planning the actual fiscal stimulus and various remedies for the issues at hand. What started out as a $350bn plan has morphed to $600bn and now is likely to top $1 trillion. They are not shy about it, and they want to stamp their mark the moment Obama takes office come mid January. On actual economics data, each $1bn spent on infrastructure will create 35,000 jobs. The team is also wary that the stimulus will not go overseas immediately to create jobs outside of the US, hence expect more on healthcare, education and infrastructure spending.
Too giddy on Obama - Some may be questioning that I have gone overboard on the optimism riding on the Obama factor. But I have been following articles and interviews on him and how he has been picking his team members. The more I read, the more convinced I am that we have the best person to lead, he is also an astute and well prepared manager. He is, in a single word, competent. If you look at how he organised his campaign for the elections, it was a focused and effective. Above the fray, above the meanness, focused on the issues and getting to the heart of the matter. Oratory skills aside, he exhibited high intelligence, a general amount of ego and deserved self-confidence. The so called goodwill riding on him when he takes office should not be discounted - anyways what better way to deal with esoteric problems such as risk aversion and irrational fear than to match it with unmitigated goodwill laced with competence.
What about demand destruction - Exports are down, shipping rates have plunged, oil price is nearing $30... surely there must be demand destruction! Or is there? There is a fundamental price for everything based on demand and supply. The irrational peaks in commodity prices has more to do with liquidity surplus, the rise of commodity centered funds, the rise of hedge funds playing trend and momentum investing, the unquestioning acceptance of analysts far fetched supply inadequacies years ahead of us... Read the EIA's weekly US oil import data. In the week ending Dec. 19, total US oil imports were 12.780M/day, versus 12.907M/day in the same week a year ago. That's only a 1.0% drop - where is hell is the demand destruction? The global credit crunch resulted in forced liquidation of global supply chains, as every one liquidated their inventory to raise cash in order to survive. The inventory sales flood the market to create a false over-supply situation while supply destruction is playing out at break-neck pace as unprofitable mines are shut down. That tells me that for many resources, we are forced to work down a lot of inventory rather than seeing a genuine demand destruction. Commodity prices were artificially high 6 months back, now its the other extreme. Very soon, we will see shipping rates on the upswing again as not only is inventory very low, but many have mistakenly shut down mines and harvesting as well.
p/s photo: Anna Tsuchiya
pps: Over the next few days I will blog on the recommended international stocks, local stocks and a high-risk portfolio selections, all based on my global market prognosis. Its been more than 6 months since I have made stocks recommendations.
Prognosis: the prospect of recovery as anticipated from the usual course of disease or peculiarities of the case
Overview – This strategy piece will probably be regarded as the more optimistic one you will ever come across in these turbulent times. I am quietly (or not so quietly) optimistic for 2009 and beyond for global stock markets. I believe we have seen the groundwork laid for possibly the mother of all bull markets over the next 3 years. It should be a gradual stop-start thing. It will be one which is loaded with inflationary pressures as well.
Expectations – The trouble with many investors is that we are always only able to perceive and view things within a certain perimeter. Back in January 2008, there were still many who viewed the global economy with a sense of bullishness, and that the real issue was higher commodity prices. We tend to feel and sense things happening around us at that point in time. Now we are surrounded by layoffs, that the many injections of liquidity are unstoppable, that the many rate cuts are insufficient, that the mother of all fiscal measures may not be adequate, that lending and risk aversion are still kings of the world – it is natural then to assume that we have a long way to go. As we sit in the middle of this crisis, it is also natural to hear experts proclaim that this is the deepest recessions the world has seen since the Depression. It is logical to conclude that we are in for the long haul. We let things around us shape the bulk of our investing decisions, when we should base our investing decisions on what things will be like 6-12 months down the road. Just like back in January 2008, we should base our investing decisions on things happening 6-12 months down the road, and not how things were like at that point in time.
The Recession – As announced a few weeks back, the recession started in November 2007, and as we stand now, its 14 months deep in recession. Prior to World War II recessions were more prolonged and deep, usually 18-22 months. Mostly it’s that the tools available to governments and central banks to deal with recessions and their effects were very limited then. The understanding of monetary and fiscal stimulus were in its infancy then. Post WW II till today, the longest recessions by ranking were:
November 1973 – March 1975:16 months
July 1981 – November 1982:16 months
December 1969 – November 1970:11 months
April 1960 – February 1961:10 months
The average being 11 months, and this present recession is already past the average at 14 months. Of course we cannot be satisfied just knowing it is already past the median. We cannot just imply that things are towards the end just based on averages, we are not in a baseball game.
Its Different this Time – This idea that things are different this time around will cost you your life savings. The more things evolve, the more things stay the same. This recessions’ fundamentals deterioration may be more widespread, but so are the measures doled out to rectify the patient. Its not really different, it just seems that way when you are in the midst of it. Business cycles are called cycles for many reasons. Things will peak and they will drop, they will boom and they will bust, each boom and bust will have their own stories to tell, but the cycle remains the same. The gravity of this crisis is matched by the unprecedented cooperation by all nations to work as one to rectify the problem. The amount of additional fiscal stimulus and the coordinated rate cuts are unprecedented. On November 9, China announced a $586B domestic stimulus package, more than triple the size of America's 2008 package. Australia announced a $10.4B package and Japan a $51B. Lump in the recent moves by EU, and the likelihood of a major one by Obama when he takes office, and you have a sense of its magnitude.
Owing to the high risk to aversion now, I believe the fiscal measures undertaken so far may have gone past what is required to bring back liquidity and consumer demand to the forefront. When your anorexic fishes are not eating, you might tend to throw everything at it to get them to eat - its actually more than they can consume even for a healthy fish. Once they start to eat again, they will find that there is actually too much food in the fridge.
You try to bake a nice cake, you have put in all the right ingredients into the bowl. Its enough to be a mother of all cakes... but no one is stirring the pot... yet. For pot stirrer information, please read on.
Confidence – The risk aversion mentality has taken strong roots, thus delaying the effects of the many measures being instituted. In fact, it is likely that we have already over-injected the required sums to revive many problem areas. It’s the confidence in the system that is wreaking havoc still. Confidence and risk aversion can also become a bubble condition – just look at the rush into yen and the rush into USD and US Treasuries. If those are not at bubble levels, I don’t know what it. Just like a pendulum, things will always sway to extremes before righting itself. I am not saying that the credit situation is over. I still think there are pockets of danger in credit cards.
Why Mother of All Bull Markets – We are seeing a readiness to go to zero interest rates in most major economies’ monetary policies. In a normal market situation, the rapid rate cuts will be balanced with a re-rating of stocks and yields, but they have not had that effect because the risk aversion mentality still rules. But that is OK, it just delays the “bull” not that the bull is not around. The bull will always surface when the right factors congregate.
The global economy has grown by nearly 70% in size from 2007 till mid 2008 before things imploded. Things imploded because of derivatives and capital issues. Yes those liquidity or multiplied liquidity was drained from the system, but it would be silly to think that they were responsible for the bulk of the 70% growth in global trade. What we have seen over the last 8 years was a huge rise in global middle class, in particular from the BRIC nations. This huge new middle class will still be consuming more resources as more emerging economies continue to pour resources to build up infrastructure. That is the inevitable “good” that comes from globalization. The demand on our resources was highlighted over the last 3 years when commodity prices went through the roof. Their price rises may have been exaggerated by the remarkable liquidity from hedge funds and specialized funds – but the underlying principle still remains. The implosion in commodity prices over the last 6 months was more due to the retraction of liquidity, rather than a rapid deterioration in demand fundamentals.
The secular bull in commodities was caused by perceptions of massive demand in emerging markets, particularly the BRIC nations - Brazil, Russia, India, and China - which were growing at unprecedented rates. As they became increasingly wealthy and industrialized, these economies represented growing new demand for energy, food and production inputs. The commodity price collapse since the summer of 2008 does not indicate inflation is out of the question - it indicates global economies are contracting deeply. The amount of new fiscal measures by the said nations will go some way to addressing the contraction slide. Mind you, all this while, we still have this new huge middle class in the global economy.
Inventory & Capacity Utilisation - Most companies have already worked down their inventory levels over the past 6 months in anticipation of weaker demand. Resource companies have shut down certain plants to reduce production capacity. All told, the current situation sees a very level of inventory for essential goods. Companies have been quicker to respond to market changes or better at trying to anticipate market trends. The scenario also pans out well for a confluence of factors to rebound smartly on the slightest hint of recovery. For example, palm oil exports have been haunted by buyers reneging and sharp drops in demand. Users have been working down on their inventory. Yesterday, data showed that exports for the December 1-25 period soared 24 per cent to 1,345,325 million tonnes from 1,087,865 tonnes shipped in the same period last month.
Inflation – Following on the above premise, it is safe to say that inflation will rise when confidence returns. Central banks will then have to drain liquidity from the system gradually. As the risk aversion was so strong, it is likely that most central banks will allow the markets to rise, and even allow inflation to seep in for the first 12 months. You do not want to ruin the hard work by tightening the noose so soon. Hence the first 12 months will be most vibrant and exciting.
Darkest Before Dawn - Investors were bailing out of mutual funds at record pace, the VIX set new highs, more than 90% of closed-end funds were trading at a discount that were much higher than the average. All these are signs of bottoming. As I have written before, it should be very useful to look for bottoms by looking at the yen/usd rate. You need risk aversion to reduce before investors are willing to get back into stocks.
Cheap valuations are a reflection of risk aversion, the rush to US Treasuries is a sure sign of risk aversion, the rush to USD and yen are a sign of definite risk aversion.
Gem #1: Markets will only start a genuine recovery when risk aversion subsides
Gem#2: Risk aversion reduction will be immediately reflected in weaker USD and yen
The fall in USD over the last two days is more due to the zero interest rate regime enacted by Federal Reserve, so that should not be a sign of risk aversion reduction.
The best guide for locating current markets' bottom: WHEN USD and YEN BOTH STARTS TO FALL IN VALUE in a sustained pattern.When these two currencies fall, it show a willingness to move exposure into other currencies or assets, be it stock or bonds. Before they are reflected in the prices, the signal will be most apparent in the currencies.
However, even then we cannot really ascertain a buying trigger. So, my advice would be to break up you investing funds into 3 portions, get ready your list of stocks to buy.
Catalyst #1: When yen/usd rate moves back to 94, plonk down 1/3 of your funds
Catalyst #2: When the rate moves to 97, move the second portion
Catalyst #3: When the rate breaks 100, move the rest in
A point not missed here is that if yen weakens against the USD, the latter would be gaining in strength. However, I am using the yen/usd rate as a guide, as I believe when the yen starts to weaken, the USD would also weaken, but not by as much - i.e. the USD would gain ground against yen but at the same time lose ground against the euros and other major currencies. I use the yen/usd rate because that is most widely followed. The yen is used as the determinant because it was the most popular currency for carry trades, the unbelievable strength now is due to risk aversion as the Japanese exporters are basically losing money and cannot compete below 90.
Comforting Data – Over the past 50 years, the S&P 500 tends to bottom:
One quarter before the GDP bottoms; 3 months before the ISM manufacturing survey bottoms; 7 months before the peak unemployment rate; 4 months before the largest decline in non-farm payrolls; and4 months before the bottom in consumer confidence surveys.
Using that as benchmarks,we should expect a genuine economic recovery somewhere between March and June of 2009.
The Obama Factor – Just like investing, to move share prices you need catalysts to make things happen. Risk aversion does not just go away, they also need to have catalysts. Obama will take office in January 2009. Call it goodwill, call it anything you want. He has already assembled a group of very credible people to help him. He has shown a clarity and purpose in hiring the best, rather than just from his own circles. The key would be the stimulus package he will be announcing. What started off as a $350bn package has now ballooned to $600bn, and now its likely to top $1 trillion.
Its not just a hopeful thing. As mentioned, the groundwork has been laid: very low interest rates, very high risk aversion, stocks at very cheap levels, governments pumping fiscal stimulus like crazy… its like everyone is working towards an Obama effect.
Confidence is a strange yet important part of global finance. A basic re-rating of 10% jump from current levels will improve valuations for a lot of toxic assets as well and in turn relives the constant need to raise capital. Further jumps in markets will see a willingness to buy even toxic assets. Things that look like being worth just 20 cents to the dollar may now be worth 50 cents to the dollar. It’s a cumulative snowball effect. Injured banks may even be able to use the capital raise to actually repair balance sheet and do actual lending, instead of constantly having to write down every quarter. You would be amazed what a 10%-20% jump in equity prices can do to the entire system.
I am looking for the Dow to reach 10,000 by February / March 2009 and to go back to 12,000 by June 2009. I cannot safely say what will happen for the second half of 2009. A lot will depend on what the central banks and governments do over the next 6 months. If they play their cards right, I think global equity markets could fully recover by end 2009 and go on a 2-3 year unprecedented bull run.
Most people are not really that badly affected by the current market turmoil, because it did not happened overnight,.... almost everyone could see it coming a mile away... only those who musta, gotta have a trade every week would have been caught a bit, even then the pain would be minimal if they employed a true trader's instinct.
Booyah... due to the time difference, I got to catch 10 minutes of utter crap and mayhem with Cramer on TV... booyah mah ass... What to buy... cash is king... cash is king but also cannot put into any banks... banks now failing at a higher rate than planes not leaving on time when you fly MAS. So, like my fellow bloggers said, keep in Milo tin ... but not chinese milk powder tin though, also got melashitminnie... you don't want to be using notes tainted with that shit later... you know the velocity of money...Stock indices did not follow the usual rules of performance and valuations... nobody told the stock prices that they had to follow certain rules on value ... the market is telling the rest of us that markets are made-up fantasy football game-like things... they will give 20x PER as long as there are bidders for them ... they will give the same almost zero PER if there are no buyers left... People with cash hoarding them... despite the massive capital injection by central banks, the banks themselves are also no lending them out. What about gold then, even that thing does not make sense anymore... it is telling us that its just a shiny yellow metal that does very little to our well being. In the end we need to buy food to keep us from hunger... ah, yes... food over gold other metals... next to food would be fire, back to cavemen tactics, need fire to cook some of the food and warmth, fire also allow us to spot danger, them robbers will come to steal our food... no more share scrips, no more share markets...
Many readers send me private emails to answer, please don't do that, I am not an advisory service... if you have a question, make sure you don't mind sharing with the rest... Is it time to buy... if you haven't already, its an OK time to buy in three or four stages, so that you can get a good average price. Do not be lulled by the 11% jump in the US, that was on low volume on Columbus Day holiday... did you also know that the top few daily all time high spikes happened around the 30s Depression as well. Yes, they had 16% daily gains then even... sellers exhaustion... whatever you call it... its OK I think, I think the Dow will try to make 10,000 as a new base to consolidate. Same with KLCI at 1,000. Then we should spend some time at these levels.
The US government saying they will buy stakes in banks is as close to ensuring that banks will lend to one another. The crisis of confidence and debilitating counterparty risk fears should subside. Its OK but do not go overboard.

 As things get more uncertain, it is useful to look at things that would help us understand the pulse of the market better. The first is the relative market valuations within various sectors or category of stocks. A look at the table below would allow us to form a good idea of the themes and plays in the markets now. Interestingly, the fundamentals indicate that investors have an appetite for risk. Tech stocks and small caps are being rewarded with the highest P/E ratios and these stocks deliver the lowest yields. Investors are pricing large cap stocks with higher yields more conservatively, possibly indicative of the uncertainty. Merrill Lynch analyst David Rosenberg recently revised his earnings forecast for S&P 500 stocks down to $28 in 2009. That puts the P/E for the S&P 500 at 29.5. He also projects operating earnings of $55 for 2010. Applying a classic recession-trough multiple of 12x against a forward EPS estimate of $55 would imply an ultimate low of 666 on the S&P 500, likely by October if our estimate of the timing for the end of the official downturn is accurate. That is easily another 20% down from present levels. If only things were that simple and straight forward. There is a theoretical valuation and projection, and there are things we cannot really project fully. In my view, the S&P 500 will not even dip below